Blazing-Fast Scientific Graphics for Python | PyQtGraph
PyQtGraph is your go-to toolkit for real-time plotting, interactive data visualization, and GPU-accelerated 2D/3D graphics all in pure Python. Whether you’re building a scientific dashboard, processing images, or analyzing signals, PyQtGraph gives you the power and flexibility to do it fast.
Features of PyQtGraph
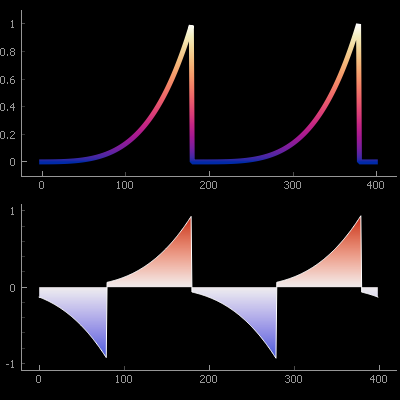
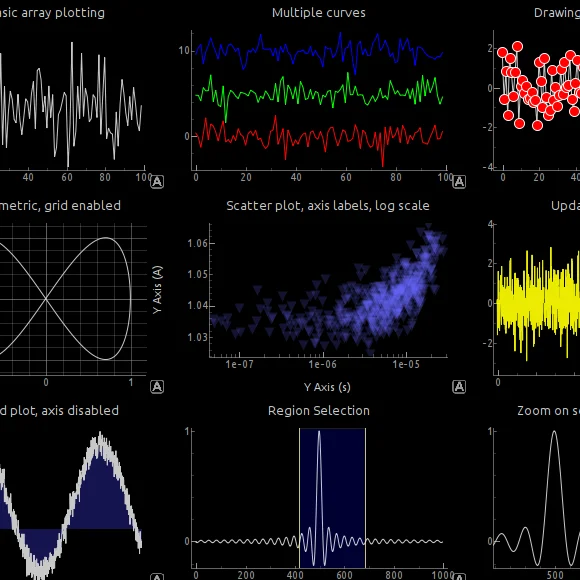
High-Performance 2D Charts
Create fast, dynamic 2D charts including lines, scatter plots, bars, histograms, and error bars. Optimized for smooth, real-time updates with large or streaming data.

Advanced Image and Volume
Visualize 2D or 3D datasets such as medical scans or microscopy. Features slicing, zooming, color mapping, and interactive ROI tools for precise data exploration.
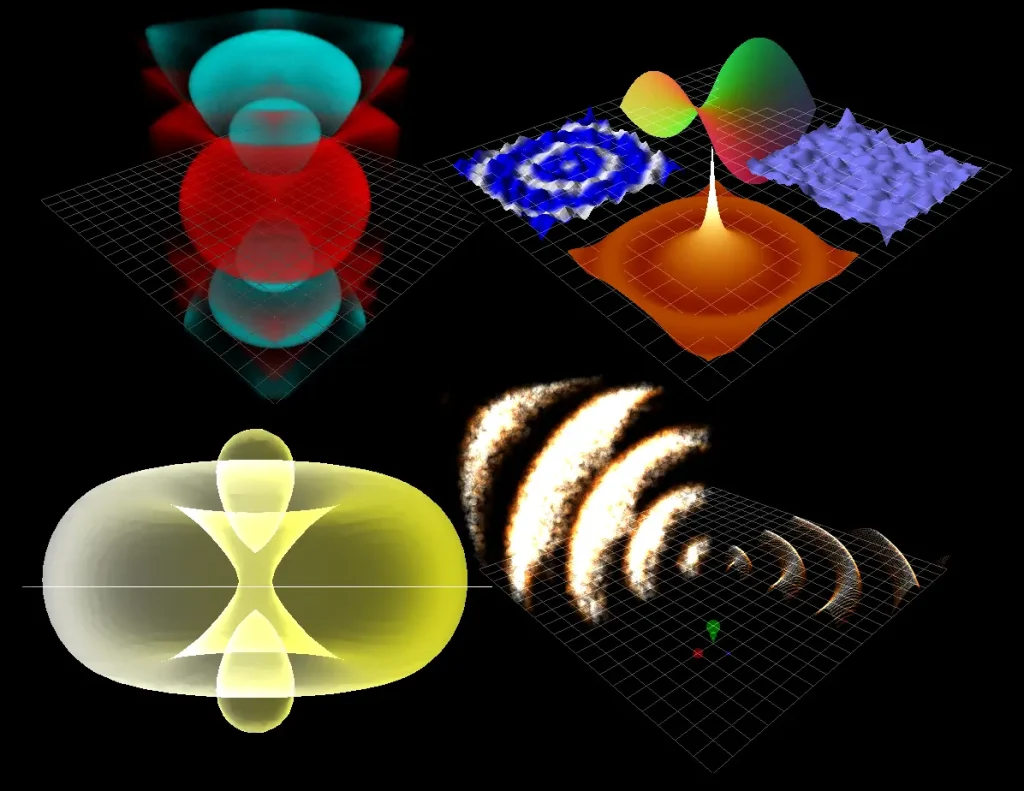
Interactive 3D Visualization
Render surface plots, volumes, and point clouds with GPU acceleration. OpenGL ensures responsive performance, making complex 3D data handling smooth and efficient.
Who We Are
PyQtGraph is an open-source graphics and GUI library built for Python developers, scientists, and engineers who need fast, responsive, and interactive data visualization. Founded by experts in scientific computing, PyQtGraph was created to bridge the performance gap in real-time plotting and GUI integration — offering both flexibility and raw speed for technical applications.
Our Mission
We aim to empower developers with tools that are:
Blazing-fast for real-time plotting and rendering
Flexible for diverse use cases like medical imaging, signal processing, and scientific dashboards
Accessible through a pure Python stack using PyQt, PySide, and NumPy
Whether you’re visualizing experimental data or building professional GUI apps, PyQtGraph provides the building blocks to get there efficiently.
What Makes Us Unique
Built entirely in Python with no external binary dependencies
Designed specifically for scientific and engineering applications
Seamless integration with PyQt/PySide and OpenGL
A vibrant, collaborative open-source community
Why People Choose Us
Purpose: Build trust and highlight your unique value.
Content Ideas:
- Open-source & Free Forever
- GPU-accelerated Performance
- Trusted by Research Labs & Developers
- Easy Integration with PyQt, PySide, and NumPy

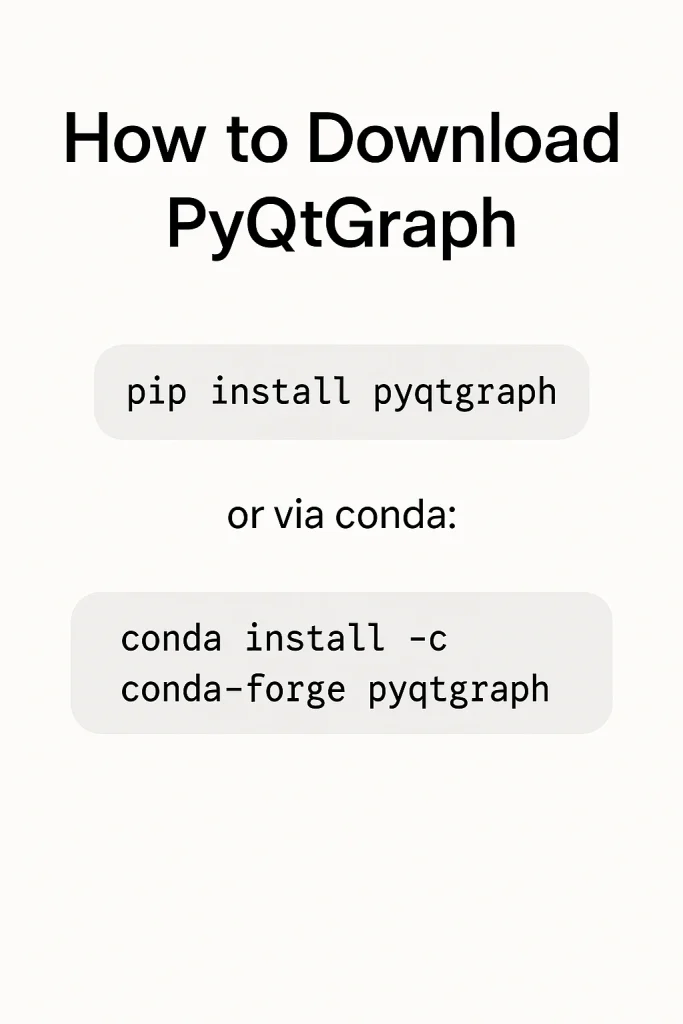
How to Download PyQtGraph?
To download PyQtGraph, you can fetch it directly from Python’s package repositories or its source code:
From PyPI using
pip: PyQtGraph is available as a Python package.From Anaconda via the
conda-forgechannel.From GitHub, you can clone the full source code for development or offline use.
You can choose any method depending on your environment or preference. Let me know if you need download links or offline .whl file support.
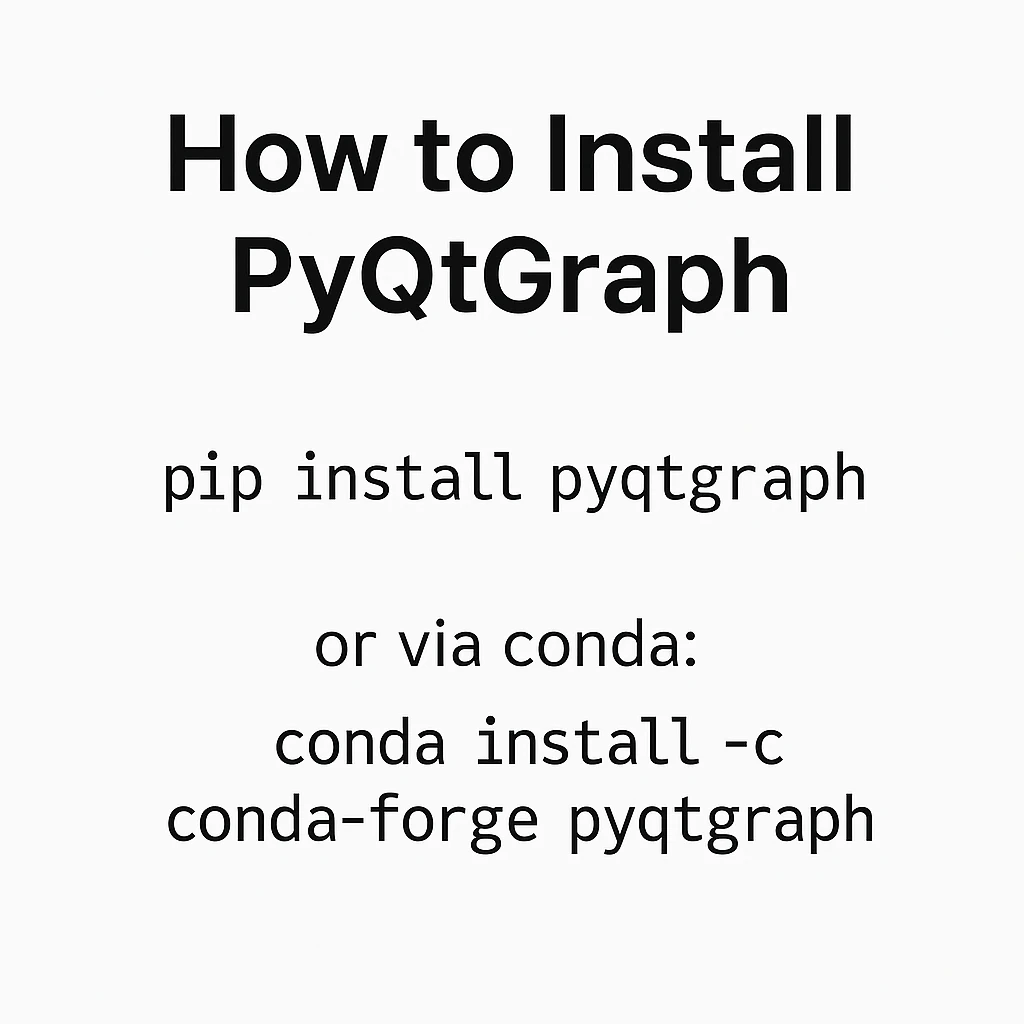
How to Install PyQtGraph?
Installation steps:
- Open your terminal or command prompt.
-
Make sure Python and pip are installed.
- Use
python --versionandpip --versionto check.
- Use
-
Run the command:
pip install pyqtgraph
-
To verify the installation:
python -c "import pyqtgraph; print(pyqtgraph.__version__)"
-
Optional: Launch the example viewer:
python -m pyqtgraph.examples
Benefits of Using PyQtGraph
PyQtGraph isn’t just a plotting library. It’s a high-performance, interactive visualization toolkit tailored for engineers, researchers, and developers working in Python.
Here’s why thousands of data scientists, academic labs, and scientific developers trust and use PyQtGraph in their workflows.
Ultra-Fast Real-Time Plotting
PyQtGraph is optimized for real-time data visualization.
- Capable of handling thousands to millions of points without significant lag.
- Ideal for live signal monitoring, oscilloscope interfaces, and sensor data visualization.
- Enables fluid user interactions like zooming, panning, and real-time updates.
Scientific-Grade Graphics
Designed with scientific computing in mind, PyQtGraph provides precision and flexibility.
- Supports complex visualizations including 2D image plots, 3D surfaces, and volume rendering.
- Built-in tools for gradient-based coloring, histograms, isocurves, and vector fields.
- Uses NumPy for high-performance numerical computations under the hood.
Seamless Integration with PyQt / PySide
PyQtGraph is built directly on top of the Qt framework.
- Natively compatible with PyQt5, PyQt6, PySide2, and PySide6.
- Easily embeds into custom Qt-based GUIs.
- Allows full event loop control, widget integration, and signal-slot interaction.
Minimal Dependencies, Maximum Flexibility
No bloated packages or unnecessary overhead.
- Only core dependencies: NumPy and PyQt / PySide.
- Works without needing heavy graphics engines or web-based interfaces.
- Perfect for resource-constrained systems or embedded Linux environments.
Interactive Widgets and Tools
Not just static plots PyQtGraph is interactive out of the box.
- ROI (Region of Interest) tools for image analysis.
- Mouse-based data inspection and manipulation.
- Built-in parameter trees for GUI controls.
Open-Source, Extensible, and Community-Driven
Fully open-source under the MIT License, making it ideal for research and commercial use.
- Actively developed with contributions from global users.
- Easily extended for custom widgets, plotting types, and plugins.
- Growing GitHub repository with community patches and discussions.
Compatibility with Platforms
PyQtGraph is designed to work across operating systems, Python environments, and development stacks. Below is a detailed breakdown of its compatibility landscape.
Supported Operating Systems
- Windows – Fully supported with all PyQt/PySide bindings
- Linux – Tested on major distros (Ubuntu, Fedora, Arch)
- macOS – Native support with PyQt and Homebrew setups
Python Versions Supported
- Python 3.7 to 3.12+
- Actively maintained for modern Python environments
- Compatible with Anaconda, virtualenv, and poetry
Qt Framework Compatibility
- PyQt5, PyQt6
- PySide2, PySide6
- Fully functional with Qt Designer-based applications
Scientific Stack Compatibility
PyQtGraph works smoothly with other scientific Python libraries:
- NumPy (required)
- SciPy, pandas, scikit-learn (for data pre-processing)
- OpenCV (for computer vision integration)
- TensorFlow / PyTorch (for ML output visualization)
Jupyter & IDE Support
While PyQtGraph is built for desktop apps, it can be embedded in:
- Jupyter Notebooks (with %gui qt magic)
- PyCharm, VS Code, Spyder (using interactive backends)
Hardware Integration
Used extensively in hardware visualization projects:
- EEG/ECG monitors
- Arduino and Raspberry Pi data dashboards
- Custom electronics with serial or USB streaming
Lightweight and Efficient
- Installation size: < 2MB
- Low memory footprint
- Perfect for both high-performance and low-power systems
FAQ's
What is PyQtGraph?
PyQtGraph is a pure Python graphics and GUI library built on PyQt/PySide and NumPy. It’s optimized for real-time data visualization, scientific plotting, and 2D/3D rendering.
Is PyQtGraph better than Matplotlib for real-time plotting?
Yes. PyQtGraph is significantly faster and more interactive than Matplotlib when dealing with real-time data or large datasets.
Which Python versions are supported by PyQtGraph?
PyQtGraph supports Python 3.6 and above. Python 2 is no longer supported.
Does PyQtGraph support 3D plotting?
Yes, PyQtGraph includes a 3D module based on OpenGL for surface plots, volume rendering, and point clouds.
How do I install PyQtGraph?
You can install it using pip:
bash
pip install pyqtgraph
Can PyQtGraph be used in Jupyter Notebooks?
Limited support is available. For best results, use %gui qt magic and run Qt applications inline.
Is OpenGL required to use PyQtGraph?
No, OpenGL is optional but recommended for 3D graphics and better performance.
Is PyQtGraph open source?
Yes, PyQtGraph is open-source under the MIT license, and contributions are welcome via GitHub.
Does PyQtGraph work with both PyQt and PySide?
Yes. It works with PyQt5, PyQt6, PySide2, and PySide6.
What are the core dependencies of PyQtGraph?
PyQtGraph requires NumPy and a Qt binding (PyQt/PySide). OpenGL and SciPy are optional.
Can I create custom GUI layouts with PyQtGraph?
Yes. PyQtGraph includes docking systems, parameter trees, and flowcharts for building dynamic UIs.
How can I embed PyQtGraph in a PyQt application?
Yes, it provides drag-and-drop ROIs, mouse zooming, panning, and other interactive tools.
Does PyQtGraph support interactive tools like ROI and zooming?
Absolutely. Just call .plot() multiple times on the same widget to overlay plots.
Can I plot multiple lines or datasets in PyQtGraph?
Yes. You can display, update, and manipulate images in real-time using NumPy arrays and the ImageView widget.
Does PyQtGraph support real-time image processing?
PyQtGraph is a pure Python graphics and GUI library built on PyQt/PySide and NumPy. It’s optimized for real-time data visualization, scientific plotting, and 2D/3D rendering.
Is PyQtGraph suitable for commercial applications?
Yes. It is MIT-licensed, so you can use it in both open-source and proprietary projects.
Can I customize the appearance of my plots?
Yes. You can adjust pen colors, line styles, backgrounds, axis labels, and more.
Can I plot complex or multidimensional data?
Yes. PyQtGraph supports plotting complex-valued data and multi-channel image stacks.
How do I create a live-updating plot?
Yes. You can adjust pen colors, line styles, backgrounds, axis labels, and more.
Does PyQtGraph support exporting plots to images?
Yes. You can export plots as PNG, SVG, or PDF using built-in exporters.
Is there a demo or example viewer?
Yes. Run this in your terminal:
bash
python -m pyqtgraph.examples
How can I contribute to PyQtGraph?
Fork the project on GitHub, follow the contribution guide, and submit pull requests.
Is PyQtGraph compatible with PyInstaller or freezing tools?
Yes, it works with PyInstaller. Just ensure all dependencies are included in the spec file.
Does PyQtGraph work on Windows, Linux, and macOS?
Yes. It is fully cross-platform and tested on all major OS environments.
Schema
PyQtGraph - Fast 2D/3D Scientific Plotting in Python
PyQtGraph is a fast, pure-Python library for real-time 2D/3D plotting, scientific graphics, and GUI development using PyQt and NumPy. #PyQtGraph
Price: Free
Price Currency: $
Operating System: Windows, macOS, and Linux
Application Category: Software
4.5