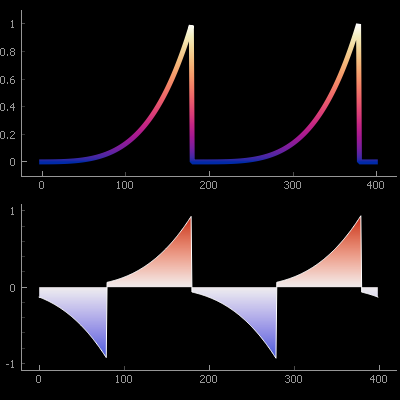
Does PyQtGraph support exporting plots to images? Yes PyQtGraph includes built-in features to export visualizations as image files like PNG, JPEG, and SVG. In this article, we’ll explore how to export plots, what formats are supported, and how to integrate image saving into your GUI workflow.
What Is PyQtGraph? Quick Overview
PyQtGraph is a powerful Python graphics and GUI library designed for scientific visualization, real-time plotting, and interactive analysis. Built on top of PyQt (or PySide) and NumPy, it’s widely used in:
- Sensor monitoring systems
- Medical and EEG viewers
- Robotics dashboards
- Embedded and real-time GUI applications
Unlike Matplotlib, which focuses on publication-quality plots, PyQtGraph prioritizes performance, responsiveness, and interactivity.
Why Exporting Plots as Images Matters
Whether you’re sharing results in a research paper, generating automated reports, or saving visual output from your GUI app, exporting plots as image files is essential.
Common reasons to export include:
- Archiving analysis snapshots
- Generating visual reports
- Embedding plots into presentations or documents
- Creating thumbnails or static previews for dashboards
That’s why many users want to know: Can PyQtGraph export its plots to images easily?
Does PyQtGraph Support Image Export? (Short Answer)
Yes, PyQtGraph does support exporting plots to image files.
It provides multiple export methods:
- Through a built-in export dialog for interactive saving
- Using Python code to save plots programmatically
- Supporting vector and raster formats like SVG, PNG, JPG, and TIFF
It even supports exporting scene graphs (e.g., layouts of multiple plots) or image items in ImageView.
Export Formats Supported by PyQtGraph
PyQtGraph uses Qt’s painting and rendering engine, which allows a range of image formats:
Format Type Description:
PNG Raster Widely used, lossless, transparent
JPG Raster Compressed, small size, no alpha
BMP Raster Bitmap format, large file size
TIFF Raster High-res print use, lossless
SVG Vector Scalable graphics for web and print
PDF Vector For embedding in academic documents
Note: Vector exports (SVG, PDF) may require QtSvg or system-level backends.
Using ExportDialog for Interactive Exporting
PyQtGraph includes an interactive export tool that can be embedded into your GUI or accessed directly via the context menu.
How to use:
- Create your plot widget
- Right-click on the plot
- Click “Export…”
- The ExportDialog window appears
- Choose the format (e.g., PNG) and save the location
This works seamlessly for:
- PlotWidget
- GraphicsLayoutWidget
- ImageView
Example:
python
import pyqtgraph as pg
from pyqtgraph.Qt import QtWidgets
import numpy as np
app = QtWidgets.QApplication([])
win = pg.plot()
x = np.linspace(0, 10, 1000)
win.plot(x, np.sin(x))
win.show()
app.exec_()
Right-click on the plot → Export…
Programmatically Exporting Plots via Code
You can also automate the export process in Python:
Example: Save as PNG
python
from pyqtgraph.exporters import ImageExporter
plot = pg.plot()
plot.plot([1, 3, 2, 4])
# Create the exporter
exporter = ImageExporter(plot.plotItem)
exporter.parameters()[‘width’] = 800 # optional size config
exporter.export(‘my_plot.png’)
You can dynamically save images during loops, simulations, or user events.
Customizing Export Size, DPI, and Background
The ImageExporter and ExportDialog provide multiple customization options:
- Width / Height in pixels
- Background color (white, transparent, etc.)
- Antialiasing toggle
- Scaling and margins
- Resolution (DPI) — for high-quality outputs
You can access these via the parameters:
python
exporter.parameters()[‘background’] = ‘w’
exporter.parameters()[‘antialias’] = True
This gives you full control over output quality and appearance.
Exporting 3D/OpenGL Plots — Is It Possible?
Yes with some limitations.
PyQtGraph supports 3D plots via its OpenGL module (pyqtgraph.opengl). You can export these using:
- QImage screen captures
- OS-level screenshot tools
- Custom framebuffer captures (advanced)
However, there’s no built-in exporter for OpenGL items due to backend limitations in Qt.
Workaround:
python
CopyEdit
gl_view.grabFramebuffer().save(‘3d_plot.png’)
This captures the current OpenGL frame as an image.
Comparing Export with Matplotlib and Others
FeaturePyQtGraphMatplotlibPlotly/Dash
Export to PNG/JPG Yes Yes Yes
Export to SVG/PDF (via Qt) Extensive Web export
Built-in GUI Export Dialog Yes No No
Export 3D Partial (OpenGL) Not native HTML/GL
Code-based Automation Easy Extensive with callbacks
While Matplotlib gives finer print-style control, PyQtGraph excels in interactive and GUI-based workflows.
Common Issues and How to Fix Them
Issue: “ExportDialog not working”
Fix: Ensure pyqtgraph.exporters are imported and you’re using a GraphicsView-based widget.
Issue: “Image file is blank”
Fix: The plot may not be rendered yet. Call QtWidgets.QApplication.processEvents() before export.
Issue: “No SVG export available”
Fix: Your PyQt installation may lack QtSvg support. Install python3-pyqt5.qtsvg on Linux or use another backend.
Real-World Use Cases for Exporting PyQtGraph Plots
- Medical Reports: Save ECG or EEG plots from live monitoring software
- Scientific Research: Auto-export graphs during simulations
- Industrial Logging: Capture sensor states as image snapshots
- Educational Tools: Students export visuals for assignments
- QA/Testing Dashboards: Visualize test runs in automated pipelines
This versatility makes PyQtGraph suitable for GUI applications that need both real-time rendering and static export.
Conclusion: Is PyQtGraph Good for Exporting Plots?
So, does PyQtGraph support exporting plots to images?
Yes and it does it well.
With both interactive dialogs and programmable exporters, PyQtGraph gives you:
- Control over image formats and quality
- Export options for both 2D and (some) 3D visualizations
- Seamless integration into custom GUI applications
It’s not just a high-performance real-time plotting library — it’s also a capable tool for producing static visual outputs for publication, sharing, and logging.
Summary Table
Feature Supported in PyQtGraph?
Export to PNG, JPG Yes
Export to SVG, PDF Yes (with Qt support)
Programmatic Export Yes
Interactive Export Dialog Yes
Export 3 D Plots Partial (OpenGL)
DPI / Background Control Yes


