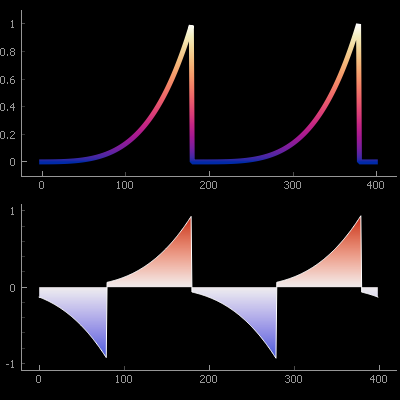
How do I install PyQtGraph? If you’re working with real-time plotting or scientific visualization in Python, PyQtGraph is a powerful tool worth exploring. This guide walks you through multiple installation methods, dependencies, and troubleshooting tips to help you get started with PyQtGraph on any platform.
What Is PyQtGraph and Why Use It?
Before diving into how to install PyQtGraph, let’s understand what it is.
PyQtGraph is a pure Python graphics and GUI library built on top of PyQt / PySide and NumPy. It’s optimized for:
- Real-time plotting
- Interactive data visualization
- Scientific GUIs
Whether you’re working on a robotics dashboard, medical imaging system, or lab simulation, PyQtGraph provides high-speed rendering and flexibility with GUI components.
Prerequisites for Installing PyQtGraph
To successfully install PyQtGraph, you’ll need the following:
- Python 3.6+ (Python 3.8+ recommended)
- pip or conda package manager
- One of the supported Qt bindings:
- PyQt5
- PyQt6
- PySide2
- PySide6
You’ll also need:
- NumPy (automatically installed as a dependency)
- PyOpenGL (only if you want 3D/OpenGL support)
Ensure your environment has these prerequisites before proceeding.
How to Install PyQtGraph Using pip
This is the easiest and most recommended method.
Basic Installation:
bashpip install pyqtgraph
This command installs PyQtGraph along with required dependencies like numpy.
Install with OpenGL Support:
bashpip install pyqtgraph PyOpenGL
Make sure you also have a supported Qt binding:
bashpip install PyQt5
This will automatically pull in the necessary dependencies including PyQt.
To install with OpenGL support:
bashconda install -c conda-forge pyqtgraph pyopengl
Anaconda environments are useful for isolated project setups, especially in research environments.
Installing PyQtGraph from GitHub Source
For bleeding-edge features or contributing to the project, install from GitHub:
bashgit clone https://github.com/pyqtgraph/pyqtgraph.git
cd pyqtgraph
pip install .
Or install in editable mode for development:
bashpip install -e .
This lets you make changes to the source and see live updates during testing.
Setting Up PyQt or PySide (Required Backends)
PyQtGraph does not bundle a Qt GUI binding — you need to install one separately.
Recommended:
bashpip install PyQt5
If you’re unsure which to choose:
- PyQt5: More mature, extensive documentation
- PySide6: Official Qt support, more permissive license
PyQtGraph automatically detects whichever one is installed.
Verifying Your Installation
To verify that PyQtGraph was installed correctly, run the following:
bashpython -c "import pyqtgraph; print(pyqtgraph.__version__)"
You can also test the full GUI by launching its built-in demo:
bashpython -m pyqtgraph.examples
This will open a window with a list of demos try the Plotting and ImageView examples to confirm everything works.
First Example: Running a Sample Plot
Here’s a minimal example to test:
pythonimport pyqtgraph as pg
from pyqtgraph.Qt import QtWidgets
import numpy as np
import sys
app = QtWidgets.QApplication(sys.argv)
win = pg.plot()
x = np.linspace(0, 10, 1000)
y = np.sin(x)
win.plot(x, y, pen='r')
app.exec_()
This code:
- Initializes a Qt window
- Creates a simple sine wave plot
- Displays it with a red line
If you see a responsive plot window, your installation was successful!
Common Installation Errors and Fixes
Error: “No module named PyQt5”
Fix: Install a Qt binding:
bashpip install PyQt5
Error: “Could not load any Qt bindings”
Fix: You likely have no Qt backend installed. Use PyQt5 or PySide6.
Error: OpenGL-related crashes
Fix: Ensure that PyOpenGL and GPU drivers are up to date:
bashpip install PyOpenGL
Error: “No module named numpy”
Fix: Run:
bashpip install numpy
Always create a fresh virtual environment when starting new projects to avoid conflicts.
OS-Specific Notes (Windows, macOS, Linux)
Windows:
- Use
python -m pipinstead ofpipif there are PATH issues - PyQtGraph works well with Anaconda and standard Python installs
macOS:
- Use
brew install python3to get the latest Python - Virtual environments recommended to avoid system conflicts
Linux:
- May need
sudo apt install python3-pyqt5for system packages - Otherwise use pip or conda for isolation
Always prefer using pip or conda within a virtual environment for portability.
Installing with OpenGL for 3D Support
If you want to use 3D features:
bashpip install PyOpenGL
Then run:
bashpython -m pyqtgraph.opengl
To see the 3D examples (e.g., surface plots, scatter plots, mesh views). OpenGL acceleration can significantly improve rendering performance for complex visualizations.
Tips for Virtual Environments
Creating a virtual environment is best practice:
bashpython -m venv venv
source venv/bin/activate # Linux/macOS
venv\Scripts\activate # Windows
pip install pyqtgraph PyQt5
Benefits:
- No system-wide conflicts
- Easy to remove/clone environments
- Clean and reproducible setups
IDE Integration and Plugin Support
PyCharm:
- Automatically detects PyQtGraph when installed via pip
- Built-in support for virtual environments
- Shows GUI previews in many cases
VS Code:
- Use the Python extension
- Use integrated terminal for installing and testing
Optional plugins:
- Qt Designer for visual layout
- Debuggers for real-time GUI updates
Conclusion
So, how do you install PyQtGraph? Whether you’re using pip, conda, or installing from source, the process is straightforward with the right prerequisites. PyQtGraph is a powerful library that shines in real-time applications, and once you’ve installed it correctly, the possibilities for interactive, scientific visualization are endless.
Now that you’re set up:
- Explore
pyqtgraph.examplesfor inspiration - Try building a small GUI with PyQt5 and live plots
- Dive into advanced topics like OpenGL and image processing


