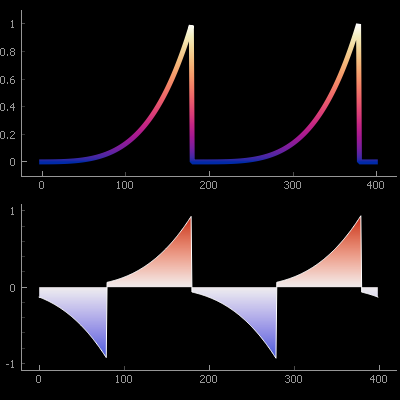
Is PyQtGraph better than Matplotlib for real-time plotting? If you’re building Python apps that require live data visualization, choosing the right library is critical. In this guide, we’ll break down the strengths, weaknesses, and ideal use cases of both PyQtGraph and Matplotlib for real-time plotting needs.
Understanding Real-Time Plotting in Python
Real-time plotting refers to the ability to update visualizations dynamically as new data arrives — commonly used in:
- Sensor monitoring
- Live financial charts
- Scientific experiments
- Robotics and automation feedback loops
The demands for speed, interactivity, and responsiveness make real-time plotting a specialized task that not all libraries handle equally.
Overview of PyQtGraph
PyQtGraph is a graphics and GUI library built on top of PyQt / PySide and NumPy. It was designed specifically for fast, interactive visualization of large datasets and real-time applications.
Key Features:
- Blazing-fast performance with OpenGL support
- Native integration with PyQt GUIs
- Real-time plotting with high frame rates
- Interactive features like Zoom, pan, and ROI
PyQtGraph excels in high-frequency plotting scenarios with thousands of updates per second.
Overview of Matplotlib
Matplotlib is one of the most popular plotting libraries in the Python ecosystem, known for producing publication-quality plots. While it’s extremely powerful for static and animated plots, it wasn’t originally designed for high-speed dynamic updates.
Key Features:
- Great for academic and static plots
- Extensive documentation and community
- Works with many backends (Tkinter, Qt, etc.)
- Supports basic animations and updates
For general-purpose plotting, Matplotlib is unmatched. However real-time plotting shows some limitations.
Real-Time Performance Comparison
Benchmark Scenario:
- 10,000 data points updating continuously
- Frame refresh every 100 ms
- Rendering in a desktop application
MetricPyQtGraphMatplotlib
Frame Rate ~50–60 fps ~5–15 fps
Latency <10ms ~200ms+
Memory Efficiency High Moderate
OpenGL Acceleration Yes No (limited)
Conclusion:
PyQtGraph is significantly faster for real-time updates due to its GPU acceleration and low-overhead design.
Ease of Use and Syntax
PyQtGraph Example:
pythonimport pyqtgraph as pg
from pyqtgraph.Qt import QtWidgets
import numpy as np
app = QtWidgets.QApplication([])
win = pg.plot()
data = np.random.normal(size=100)
curve = win.plot(data)
def update():
curve.setData(np.random.normal(size=100))
timer = pg.QtCore.QTimer()
timer.timeout.connect(update)
timer.start(50)
app.exec_()
Matplotlib Example (with FuncAnimation):
pythonimport matplotlib.pyplot as plt
import numpy as np
from matplotlib.animation import FuncAnimation
fig, ax = plt.subplots()
line, = ax.plot([], [], lw=2)
xdata, ydata = [], []
def update(frame):
xdata.append(frame)
ydata.append(np.sin(frame))
line.set_data(xdata, ydata)
ax.relim()
ax.autoscale_view()
return line,
ani = FuncAnimation(fig, update, frames=np.linspace(0, 10, 200), blit=True)
plt.show()
Comparison:
- PyQtGraph requires understanding PyQt GUI architecture
- Matplotlib is more beginner-friendly but becomes complex for high-speed updates
GUI Integration: PyQtGraph vs. Matplotlib
PyQtGraph:
- Designed for embedding in PyQt apps
- Seamless integration with layouts, widgets, and events
- Can handle multiple plots, image views, sliders, etc., in one window
Matplotlib:
- Can embed in GUI frameworks (Tkinter, PyQt), but not as seamlessly
- Needs additional effort for event handling and performance tuning
Verdict: PyQtGraph is more native and streamlined for GUI-based apps requiring interactivity.
Visualization Quality and Customization
PyQtGraph:
- Focuses on performance over aesthetics
- Less visually polished out-of-the-box
- Custom styling requires code-based configuration
Matplotlib:
- High-quality, publication-ready charts
- Rich styling options (fonts, colors, LaTeX)
- Tight control over layout and annotation
Verdict:
- For beautiful static plots: Matplotlib wins
- For responsive dynamic dashboards: PyQtGraph wins
Use Cases Where PyQtGraph Wins
- Real-time signal processing
- Medical imaging (ECG, EEG, MRI viewers)
- Robotics & automation diagnostics
- Sensor network visualization
- Live financial tickers or crypto dashboards
- Interactive simulations in physics/engineering
PyQtGraph supports high frame rates, responsive interaction, and OpenGL acceleration — all essential for real-time apps.
When to Prefer Matplotlib Instead
- Academic research papers and reports
- Data storytelling and presentations
- Static or slow-updating dashboards
- Advanced chart types (violin plots, heatmaps)
- You need advanced style customization or LaTeX rendering
Matplotlib is the de facto standard for scientific plots, where style matters more than speed.
Limitations of Both Libraries
PyQtGraph Limitations:
- Steeper learning curve due to PyQt
- Limited styling options
- Web integration is not native (no browser support)
Matplotlib Limitations:
- Poor real-time performance
- High CPU usage during frequent updates
- GUI integration is functional but not optimal
Ecosystem & Community Support
PyQtGraph:
- Smaller, focused community
- Active development on GitHub
- Limited number of tutorials but growing
Matplotlib:
- Massive community and adoption
- Extensive documentation and Stack Overflow support
- Thousands of open-source examples
If community support is critical, Matplotlib has the edge. For performance-focused developers, PyQtGraph has strong momentum.
Conclusion: Which is Better for Real-Time Plotting?
So, is PyQtGraph better than Matplotlib for real-time plotting?
Yes, if speed, responsiveness, and interactivity are your top priorities.
ScenarioBest Choice
Real-time sensor data dashboard PyQtGraph
Publication-ready academic figures Matplotlib
Interactive PyQt GUI app PyQtGraph
Animated but slow-updating visuals Matplotlib
Desktop app with high-speed signals PyQtGraph
If you’re building live data visualization apps with thousands of updates per second, PyQtGraph is the better tool. But for beautiful, presentation-ready plots, Matplotlib still dominates.